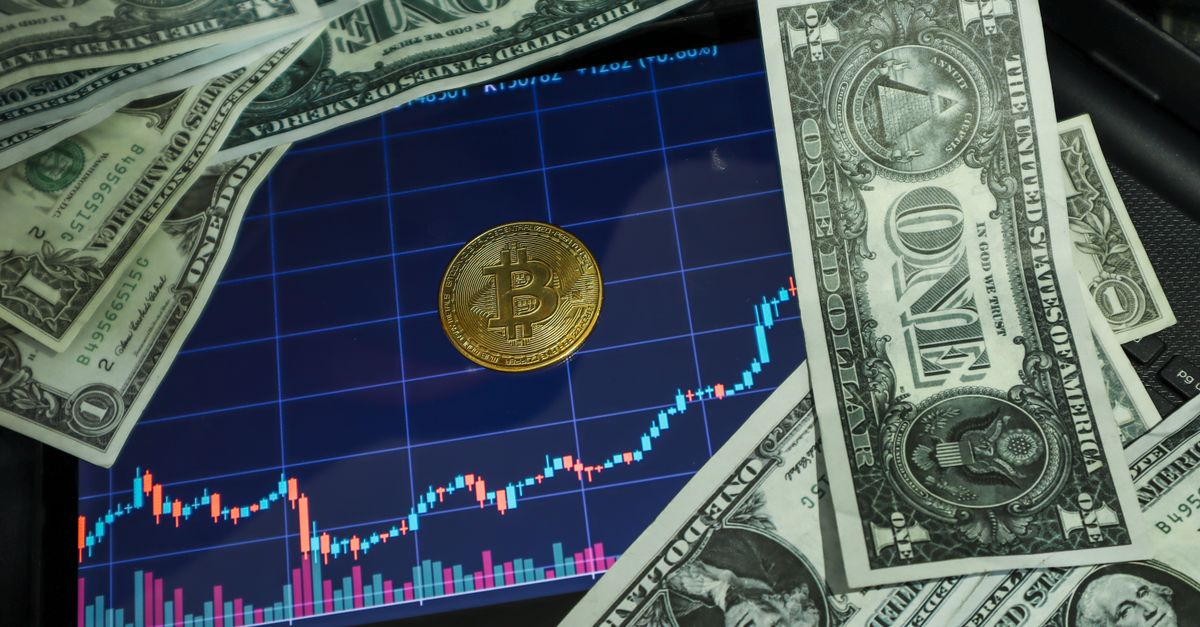
On the morning of July 14, 2026, bitcoin was going nowhere. It sat around $62,600, down 0.3% on the day, with traders parked and waiting. By that evening it had pushed past $64,500 — a gain of nearly 4% in 24 hours. Nothing changed on-chain. No protocol upgrade shipped, no exchange failed, no whale moved. The only thing that happened was a Bureau of Labor Statistics press release.
That single session is the cleanest available illustration of how US economic data drives bitcoin in Q3 2026. Understanding the mechanism — and its limits — matters more than any price target.
What the June CPI print actually did
June headline CPI came in at 3.5% year over year against a 3.8% consensus, down from 4.2% in May. The month-over-month figure was the eye-catching one: -0.4%, versus a -0.1% forecast and a +0.5% prior reading. That was the steepest single-month decline since April 2020. Core CPI, stripping out food and energy, printed 2.6% annually against 2.8% expected, with the monthly core reading flat versus a forecast of +0.2%.
Bitcoin's response was staged rather than instantaneous. Per CoinDesk's live coverage, BTC reached $63,400 by 12:37 PM (up 2%), climbed to roughly $64,300 by 3:09 PM after Fed Chair Kevin Warsh's congressional testimony, and closed above $64,500. The Nasdaq gained 1% on the same news — bitcoin roughly quadrupled the equity index's move on identical information.
The rates market repriced hard. July rate hike odds, which had reached about 50% after hawkish comments from Governor Christopher Waller the previous day, collapsed to 12% after the print. Note the direction: in Q3 2026 the live debate is whether the Fed hikes, not whether it cuts. September odds barely moved, holding at 51.2%.
The transmission mechanism, in order
Data does not touch bitcoin directly. It travels through a chain, and each link can break:
- Data lands and shifts the market's estimate of the Fed's next move.
- Rate expectations reprice, moving the front end of the Treasury curve and the dollar.
- Real yields move, changing the opportunity cost of holding a zero-yield asset.
- Risk appetite adjusts, and leveraged crypto positioning amplifies the result.
Bitcoin's outsized reaction versus equities comes from the last link. Perpetual futures funding, tight stop clusters and 24/7 liquidity mean a modest repricing in rate expectations gets multiplied through forced position unwinds. That amplification runs in both directions, which is why the same mechanism that produced July's rally produced sharp drawdowns earlier in the year.
Why the July rally was thinner than it looked
The composition of the June print undercut the headline. Energy prices fell 5.7% on the month and gasoline dropped 9.7% — meaning most of the disinflation came from a component that had already reversed by the time the data published.
Jake Kennis of Nansen put it plainly in comments to CryptoSlate: "The softness was led largely by energy... this is a cooler print rather than confirmation of durable disinflation." On the same day the report landed, WTI crude was trading up 2-3% toward $80 a barrel and Brent had touched above $87 before easing to roughly $85, with Strait of Hormuz tensions supplying the bid. June CPI measured a world that no longer existed.
Warsh, testifying hours after the release, declined to endorse the number: "It's one data point. I don't want to overread or cherry-pick data. There might be some who say, 'Look, mission accomplished, everything is swell.' That is not my view." He also delivered a line worth filing away — "Inflation is a choice" — alongside an explicit warning that the Fed is not in the "bailout business" for crypto. That framing removes a put that some allocators had assumed existed.
Payrolls are the other lever — and it cuts the same way
Labor data has moved bitcoin as reliably as inflation data this year, with the sign inverted from intuition. Weak jobs numbers have been bullish; strong ones bearish.
The June employment report, released July 2, showed 57,000 nonfarm payrolls added against a consensus near 110,000-115,000, with unemployment steady at 4.2%. Bitcoin traded up about 1.3% to roughly $62,420 on the miss. Six weeks earlier, May's report delivered 172,000 jobs against expectations closer to 85,000, and bitcoin promptly slipped below $62,000 as hike odds rose into the June 16-17 FOMC meeting.
The complication is wages. CoinDesk flagged in May that a hiring slowdown only helps bitcoin if average hourly earnings cool alongside it. A report combining weak headline payrolls with accelerating wage growth is the worst configuration for BTC — it signals a slowing economy that still cannot get inflation down, leaving the Fed hawkish into weakness. Traders reading only the headline number get caught by this.
What to watch through the rest of Q3
Three things determine whether bitcoin holds its post-CPI gains.
Core, not headline
With energy doing the work in June, core CPI and core PCE are the prints that carry information. A core reading that fails to confirm June's softness would unwind the rate repricing that drove the rally.
Oil feeding back into July data
Crude strength during July flows into the July CPI report published in August. A hot energy contribution would reverse the mechanical benefit that produced the June surprise.
Thinning liquidity
The most underappreciated risk is structural. Bitcoin ETF trading volume had collapsed 78% to about $1.25 billion daily, down from a $5.8 billion peak. Thin books amplify data-driven moves in both directions and make headline levels less durable. Bitcoin near $65,000 remains roughly half its October 6, 2025 record of $126,198 — this is a market repairing damage, not one riding momentum.
The practical read
Bitcoin in Q3 2026 trades as a high-beta expression of US monetary policy expectations. It is not behaving as an inflation hedge; it rallied on falling inflation, which is the opposite of what the debasement thesis predicts. It is behaving as a liquidity asset, and liquidity is set in Washington.
For anyone positioning around releases, the discipline is straightforward: read the composition before the headline, check whether the surprise is durable or mechanical, and treat any single print the way the Fed chair publicly said he treats it — as one data point. The market that moved 4% on June CPI is the same market that will move 4% the other way when the next number disappoints.